Lung function parameters for
simulation based training
Josef X. Brunner, neosim AG, Chur, Switzerland
Optimizing respiratory therapy in intensive care is a challenge for clinicians at all levels of expertise. The difficulties rise with the degree of illness and along rises the associated morbidity and mortality. Simulation based training is a promising avenue to improve the learning curve and to explore the respiratory management of such difficult and rare cases. In simulation session, patient decompensation can be simulated and therapy options can be practiced without risk for patient - and without risk for clinicians!
In contrast to other simulators, autonomous simulators do not need an operator to "fake" vital signs because they create vital signs in real-time and based on physiological parameters that were set to define patient cases. Unfortunately, it is not easy to find values for those parameters in the literature. This white paper is intended to fill the void.
Fundamental set of parameters
Simulation of respiratory failure requires a minimal set of parameters for autonomous simulators to operate. Usually, it is convenient for the learner to first understand situations without respiratory failure and thus the set of parameters also needs to cover normal lungs. The following table provides a list of such parameters to simulate respiratory cases:
- Total respiratory compliance Crs
- Lung compliance CL
- Chest wall compliance Cw
- Compliance above the upper inflection point Cend
- Airways resistance Raw
- Airways dead space Vdaw
- Functional Residual Capacity FRC
- CO2 production
- Oxygen uptake
Values for each of these parameters need to be known for normals and typically for the two big respiratory problems in intensive care: ARDS and COPD.
What predicts the value of a lung function parameter?
Common sense tells us to use actual body measures like height and weight to calculate lung parameters in health. Unfortunately, this is not true for a number of reasons, including our habits to eat and accumulate weight thus putting a large frame around a fragile body. Therefore, predicted body weight PBW rather than the actual body must be used. A number of formulas exist to calculate PBW and there is a preference for a certain PBW formula to use in intensive care applications[8]. However, the following simplified formula provides values accurate to 1% of the recommended formula:
PBW in women: height - 100cm, subtract 10%, subtract 5
- example 172 cm woman: 172-100=72, 72-7.2=65, 65-5=60kg PBW
PBW in men: height - 100cm, subtract 10%
- example 172 cm man: 172-100=72, 72-7.2=65kg PBW
Using the PBW, the parameters for autonomous simulators can be calculated according to Table 1
Table 1: Predicted lung function parameters for simulation training. The number in square brackets refer to the references given below.
| Predicted normal | Predicted ARDS | Predicted COPD | |
|---|---|---|---|
| Total respiratory compliance Crs |
0.8 ml/mbar/kg [2,5] |
0.6 ml/mbar/kg [2] |
0.9 ml/mbar/kg [2] |
| Lung compliance CL |
1.8 ml/mbar/kg [5] |
1.0 ml/mbar/kg [see text] |
2.4 ml/mbar/kg [see text] |
| Chest wall compliance Cw |
1.44 ml/mbar/kg [see text] |
1.44 ml/mbar/kg [see text] |
1.44 ml/mbar/kg [see text] |
| Compliance above the UIP |
8 ml/mbar/kg [6] |
8 ml/mbar/kg [6] |
8 ml/mbar/kg [6] |
| Airways resistance Raw |
12 mbar/(L/s) [2] |
13 mbar/(L/s) [2] |
20 mbar/(L/s) [2] |
| Airways dead space Vdaw |
2.2 ml/kg |
2.2 ml/kg |
2.2 ml/kg |
| Functional Residual Capacity FRC |
27 ml/kg [4,5,7] |
17 ml/kg [1,4] |
|
| CO2 production | 2 ml/min/kg+67.5 [3] | increase for sepsi | increase for WOB |
| Oxygen uptake | 2.5 ml/min/kg+67.5 [3] | increase for sepsis | increase for WOB |
Lung compliance CL and chest wall compliance Cw make up the total respiratory compliance Crs according to the formula:
1/Crs = 1/Cw + 1/CL
Therefore, only two of the compliance values can be freely chosen, the third is determined according to the formula. Because Crs and CL are more widely published than Cw, Cw in normals was calculated using the above formula.
Compliance above the upper inflection point UIP, sometimes referred to as Cend, is rarely measured and prediction formulas are thus not available. To estimate Cend, the formula of Venegas et. al. was used to create typical pressure-volume curves published by Harris et.al. Figure 1 shows two pairs of data: on the left, the original Venegas equation with the original parameters and on the right a more realistic pV curve where the total lung capacity was reduced to 1500ml above FRC and the lower and upper inflection points were moved to 4mbar and 16mbar, respectively. The top curves show the pressure-volume curves (pV curves), the bottom curves show the local compliance dV/dp with dp being 10mbar.
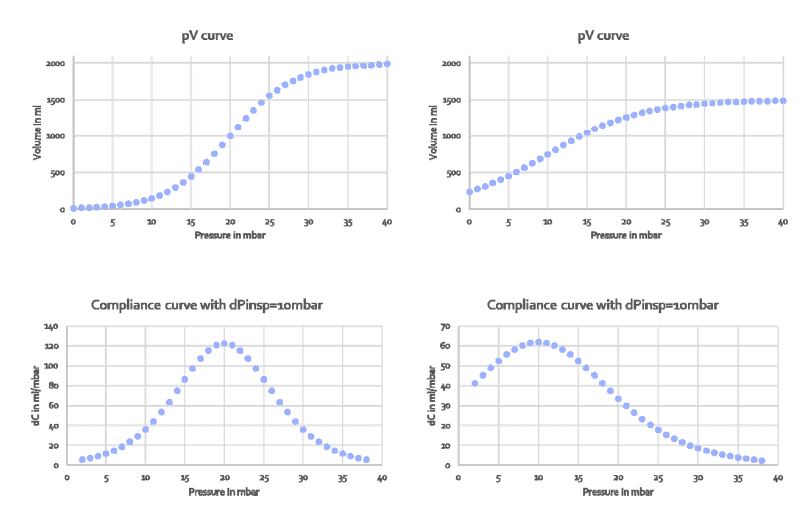
Figure 1: Pressure-volume curves created by the Venegas equation (top row) and its the first derivative dp/dV, i.e. compliance distribution to create those curves (bottom row). Left two panels: original Venegas parameters, right two panels: parameters set to create a typcial pressure-volume curve measured in patients
In the original Venegas equation, compliance changes from around 5 to 120 and inflection points are clearly visible. In the more realistic curve on the right,
compliance changes from 2 to 62 and inflection points are barely visible. The message is: inflection points are not clearly visible unless the compliance difference along the curve is made to vary dramatically. For example in TestChest (Organis GmbH, Landquart, Switzerland), the compliance above and below the inflection points should be set to <10ml /mbar.
Making parameters to represent diseases
Apart from normal values, Table 1 also contains predicted parameter values for ARDS and COPD. These values are much harder to come by because there are fewer cases, they are much harder to study, there is rarely a steady-state and the definition of ARDS, for example, is under constant revision. Only recently some authors have started to publish data for use in simulation based teaching [2]. Many subtle details are still not known, for example pV curve details such as inflection points. It is therefore up to the teacher to match the parameters with the real cases
Discussion
Parameters set in simulation are intended to create insight and the results of simulation should be fairly obvious to the learner. Subtle changes may go unnoticed while stark differences will help to create the learning effect. The values given in Table 1 were selected from the available literature with the attempt to create noticable differences for simulation based teaching. They are not intended to represent normal values for actual patients because the scientific epidemiologic basis is lacking and the parameter values have to be considered anecdotal. However, the values of Table 1 were measured on actual patients and are thus real. It may be necessary to create even larger differences between normal, ARDS and COPD than presented in Table 1. For example, to show the effect of increased Raw in COPD, it may be necessary to increase resistance up to 50 mbar/(L/s) on the simulator.
Tubings, connectors and filters will have a real impact on the airways resistance. In Table 1, the influence of a 7mm endotracheal tube is included in the Raw value (7mm tube was used by the investigators on average). Other components like heat-and-moisture exchangers are not included and, if added to the curcuit during simulation, they will automatically increase resistance because they are physically present.
Airways resistance is often flow dependent. It is therefore important to state the flow at which resistance measurements were made. Unfortunately, this information was not available in the cited papers.
There is considerable confusion in the definition for compliance - but that shall not be part of this discussion. All compliance values stated in Table 1 are quasistatic compliances, i.e. measured in no-flow conditions or calculated to represent no-flow conditions.
Dead space in Table 1 is airways dead space, i.e. the series component of dead space. Tidal volume needs to be larger than airways dead space to create any alveolar ventilation. Alveolar dead space or physiological dead space is not considered here.
Conclusion
To move from conventional to autonomous simulation requires an effort which is not neglicable. Parameter values which are pertinent for any given case must be selected before simulation can start. However, the return on this investment is considerable: highly consistent simulation experience and significantly reduced cost of operation.
References
[1] Aguirre-Bermeo et al. Ann. Intensive Care (2018) 8:25
[2] Arnal et al. Respir Care. 2018 Feb;63(2):158-168
[3] Arndt et al.J Clin Monit. 1995 May;11(3):165-7
[4] Bikker et al. Critical Care 2008, 12:R145
[5] Brunner et al. Pulmonary Function Indices in Critical Care Patients - 1988 ISBN 9783642730405
[6] Harris et al. Respir Care 2005;50(1):78 -98.
[7] Ibanez et al. Intensive Care Med. 1982;8(4):173-7.
[8] Linares-Perdobo CHEST 2015; 148(1): 73 - 78
Conflict of interest statement: neosim AG designs and markets autonomous lung simulators for medical training.
TestChest is a registered trademark of Organis GmbH, Landquart, Switzerland